
I explained in a previous blog post about getting more out of your monitoring of the Power Platform canvas app with custom logging. What if these custom measures have thresholds? How do we get notified?
How do we get notified?
From the previous blog, we learned how to define custom logging via the trace function and sent them to Azure Application Insights to collect the information and analyse the output. The final step is to alert when a custom measurement has exceeded certain thresholds. What do we need? Code your custom logging; Collect trace information in Azure Application Insights and analyse; Notify via Alerts if measurement exceeded a threshold or when an error/issue, as shown in the illustration from left to right.
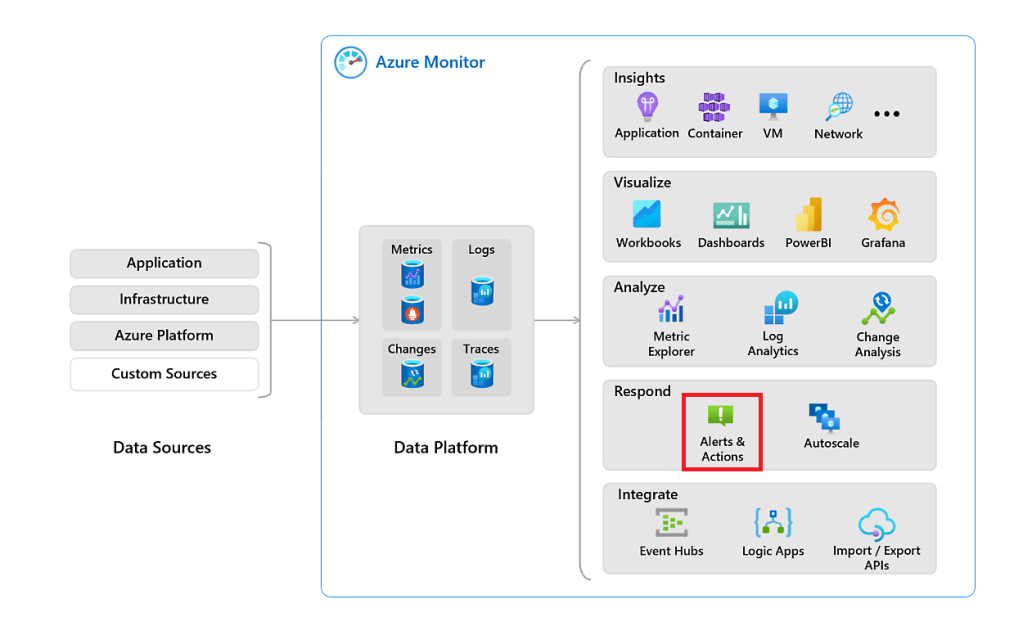
As we look again at Azure Monitor in the section “Respond”, we have a tool called Azure Monitor Alerts & Actions. It can help us get notified when the custom logging has exceeded a threshold or an issue is detected.
What are Azure Monitor Alerts?
Alerts is a feature provided by Azure Monitor that enables you to proactively monitor and get notified of potential issues or exceeded thresholds in your Power Platform Applications.
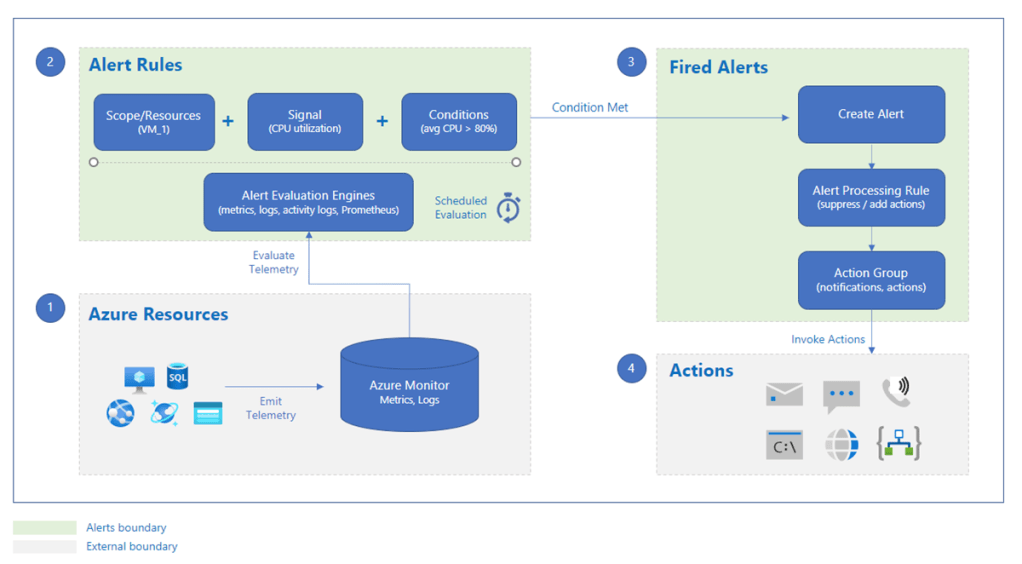
With Azure Monitor Alerts, we can define conditions or metrics that trigger an alert when they meet certain thresholds. Azure can notify a person or a team through various channels, including email, SMS, push notifications, and webhooks, when an alert is triggered. Automating actions to mitigate or resolve issues based on the alert is possible.
Azure Monitor Alerts help us to stay on top of potential issues, take proactive measures to minimise downtime, and improve the availability and performance of your Power Platform application.
More on Azure Monitor Alerts & Actions.
Let us look at an example.
Example: Measure the time a patch takes to create a record on a SharePoint list
In the example from the previous blog, we collect a record’s patch duration towards a SharePoint list.
//Set the start time
Set(varStartTime,Now());
//patch values to a list on SharePoint
Patch( 'Test List for Trace Function', Defaults( 'Test List for Trace Function' ), { Title: User().FullName, Date: Now() } );
//Set the end time
Set(varEndTime,Now());
//Calculate the time difference in milliseconds
Set(varRunTime,DateDiff(varStartTime, varEndTime, Milliseconds));
//Trace the result
Trace(
   "SharePoint patch feedback",
   TraceSeverity.Information,
       {
         PatchDuration: varRunTime
       }
     );
What did I do to define the threshold upfront?
To define the threshold of a specific custom logging, we first create a baseline of the action we’re monitoring. Especially when we need to monitor and alert, we collect and analyse the result in all other cases. In this case, I have gathered several patch time results from several runs to calculate an average baseline of the patches to that specific SharePoint list. As an intermediate result, the patch time value was 250 ms. You can then define your thresholds and see what’s still acceptable and define the maximum point where you would like to get a message that’s not acceptable. In this example, I want to get alerted for every patch duration value higher than 350 ms. These values here our pure for illustration.
How to create an Azure Monitor Alert?
Go to portal.azure.com; select your Azure Application Insights resource, go to the ” Monitoring ” section, and click “Logs”.
traces
| where message == "SharePoint patch feedback"
| extend PatchDuration = toint(customDimensions.PatchDuration)
| project PatchDuration, timestamp
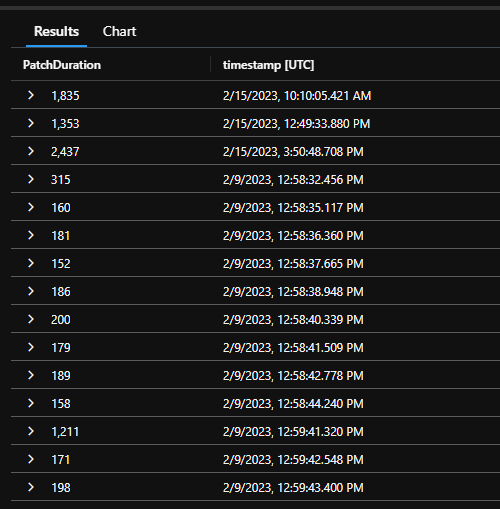
The above Kusto code gets the patch duration of each record creation in the SharePoint list. See the result below:
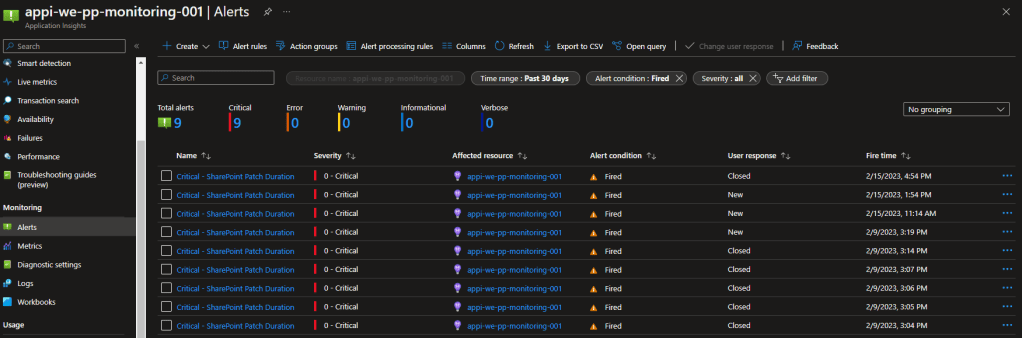
This view line of code will help us to get the information we need to create an alert. Go to the same section, “Monitoring”, and select “Alerts”.
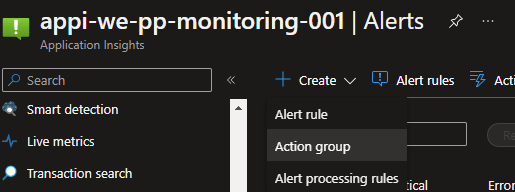
Click on “Create”, and you have three options Alert rule, Action group, and Alert processing rules.
Let me explain short those three options:
- Alert rule: An alert rule monitors your telemetry and captures a signal that indicates something is happening on the specified resource. The alert rule captures the value and checks to see if it meets the criteria of the condition. If it meets the conditions, an alert is triggered, which initiates the associated action group and updates the state of the alert—more information.
- Action Group: action groups will notify users about the alert. An action group is a collection of notification preferences defined by an Azure subscription owner. These notification types are available: Email/SMS message/Push/Voice—more information.
- Alert processing rules: Alert processing rules allow you to apply processing on fired alerts. Alert processing rules are different from alert rules. Alert rules generate new alerts, while alert processing rules modify the fired alerts—more information.
Select create “Alert Rule”
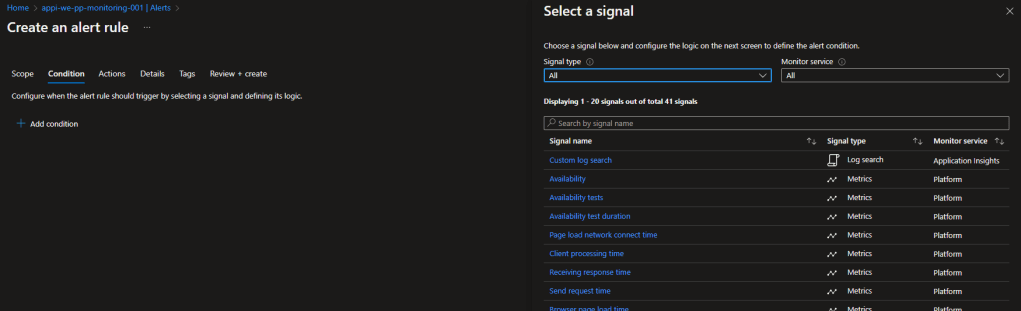
Select “Custom Log Search”
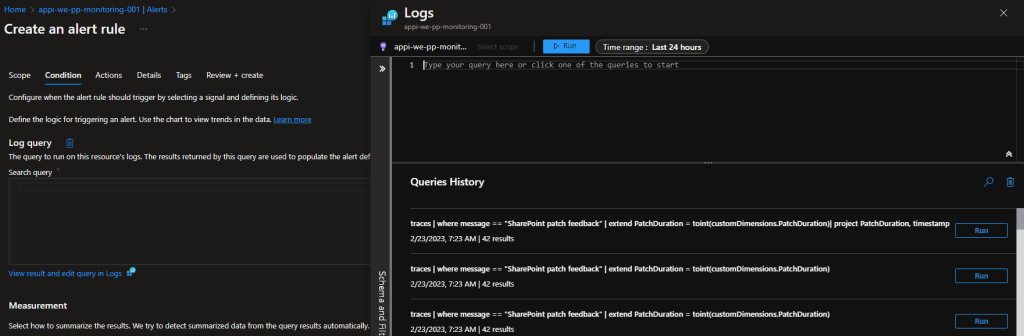
Add the Kusto query, select from the query history, and click continue editing alert.
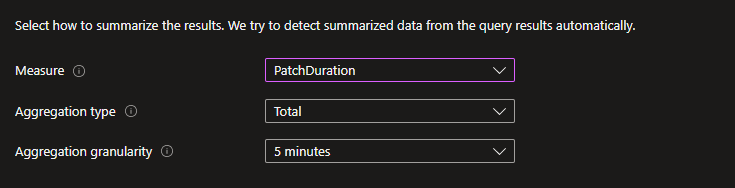
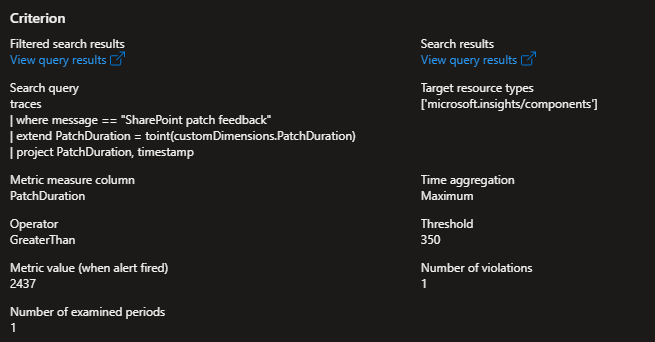
Select the measure to “PatchDuration”, type = duration and aggregation granularity = 5 minutes.
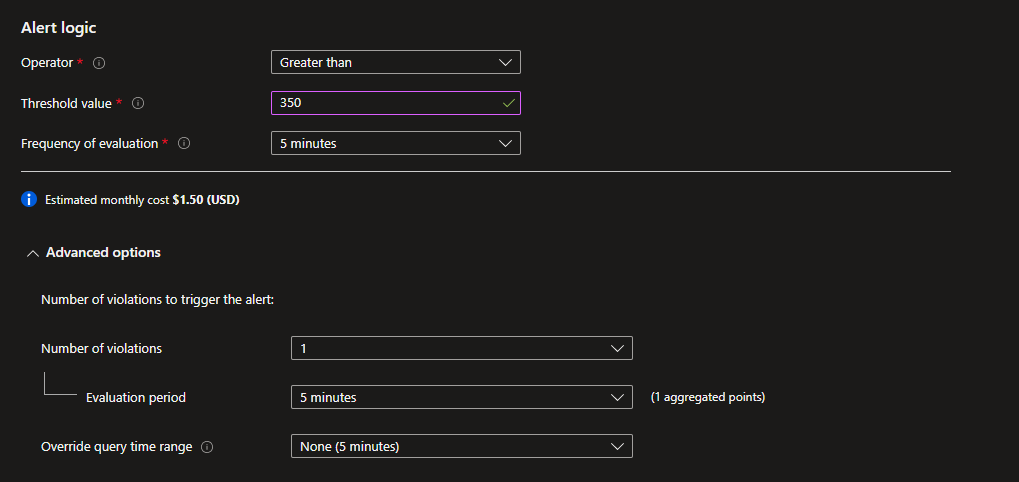
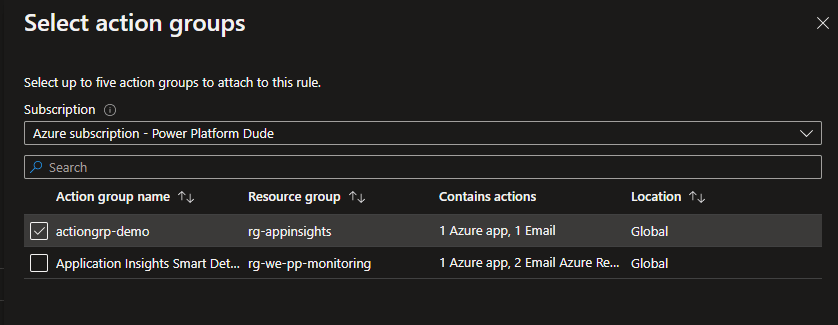
Set alert logic to greater than 350ms each every 5 minutes. Click “Next: Actions >”. Select an existing action group or create a new group. In the example, an existing action group is used.
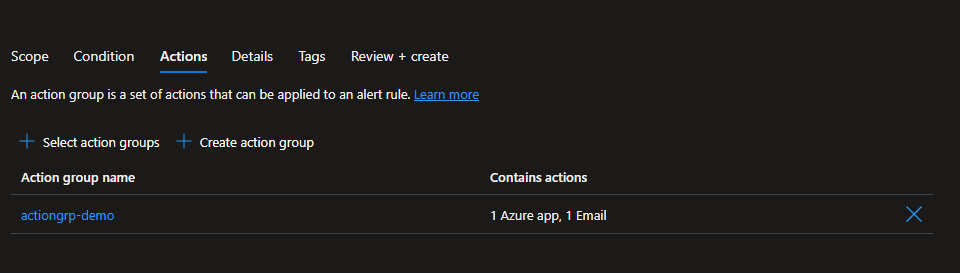
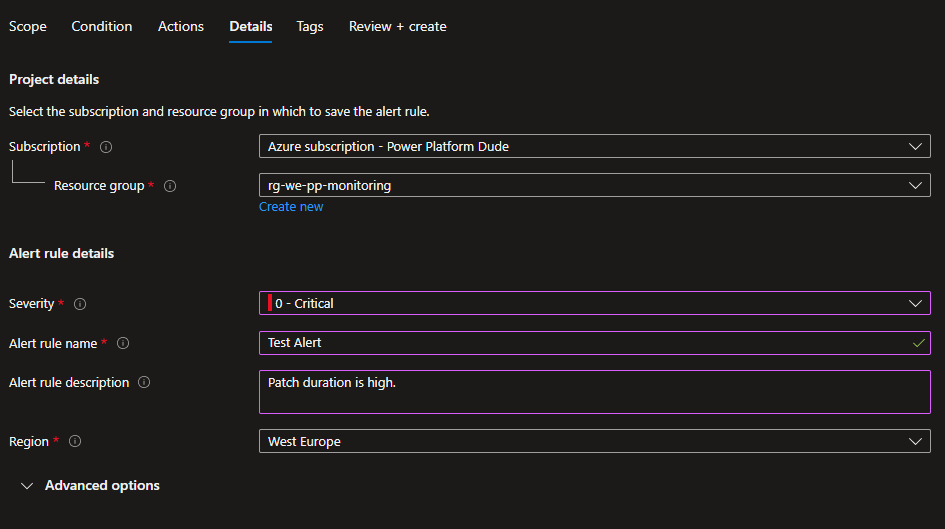
Click “Next: Details >”

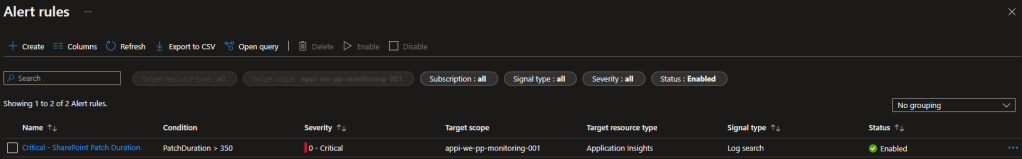
Review and create the alert. When create the rule is visible in the alert rule list.
Conclusion
Getting a notification for custom logging is:
- Easy integration with Azure Application Insights
- Become proactive on your custom logging
- Define the correct notification trigger so that you have the proper amount of notifications
If you like this blog. Please give me a dumbs up, share the blog or leave comments below.
Photo by Sigmund on Unsplash
