

How does Gartner define application monitoring?
Gartner defines application performance monitoring as monitoring software application’s performance, availability and use. It includes tracking critical performance metrics, recognising and diagnosing performance issues, and taking proactive steps to solve problems before they affect end users.
Why is it important to monitor?
There are several reasons why it is essential to monitor a Power Platform application:
- Performance: Track the application’s performance and quickly detect and resolve issues, improving the user experience.
- Availability: Track whether the application is always available to users and respond fast if there are issues with availability.
- Security: Identify and track security issues, including breaches and attacks, better-protecting users’ data.
- The root cause of errors: Trace the root cause of errors in the application and resolve them, improving the reliability and stability of the application.
- Compliance: In some cases, monitoring may require to comply with regulations and data protection requirements.
In general, monitoring a Power Platform application is critical to ensure that it remains efficient, reliable, and secure and provides users with a fantastic experience.
Which tool do we use to monitor the Power Platform application?
We can use Azure Monitor because it is a complete set of tools that helps to monitor applications, and Azure Application Insights is part of it. In addition to Azure Application Insights, it includes Azure Log Analytics, Dashboards workbooks, and much more. Azure Application Insights lets us quickly detects and fix issues with the Power Platform application to ensure that it is available, efficient, and reliable.

Some of the critical capabilities of Azure Application Insights include the following:
- Request tracking: It keeps track of the number of requests and their performance, allowing monitoring response times, identifying slow requests and finding related errors.
- Dependencies tracking: See which dependencies the application uses and how they affect its performance.
- Exception tracking: Track and report unhandled exceptions, allowing to diagnose and resolve errors quickly.
- User telemetry: Monitor user behaviour and usage patterns, helping to improve the user experience.
- Metrics: Looking at various metrics and charts gives insight into the application’s performance.
- Live Stream: Real-time debugging and diagnostics can help to resolve issues as they occur quickly.
What do we monitor of a Power Platform application / Dataverse database?
Azure Application Insights includes the following monitoring capabilities for monitoring Power Platform applications:
- Performance data: Monitor the performance of the canvas app, including response times, request rate, and any server or network errors.
- Usage data: Track the usage of the canvas app, including the number of users, the frequency of use, and the duration of sessions.
- Error and exception data: Monitor any errors or exceptions in the canvas app, and track the root cause of these issues.
- Custom events and metrics: Define custom events and metrics to track specific aspects of the canvas app’s behaviour, such number of distinct user actions or the performance of particular features.
- Dependency data: Monitor the dependencies of the canvas app, including any external services or APIs that the app relies on, and track the performance of these dependencies.
How do we start to monitor a Power Platform Canvas app?
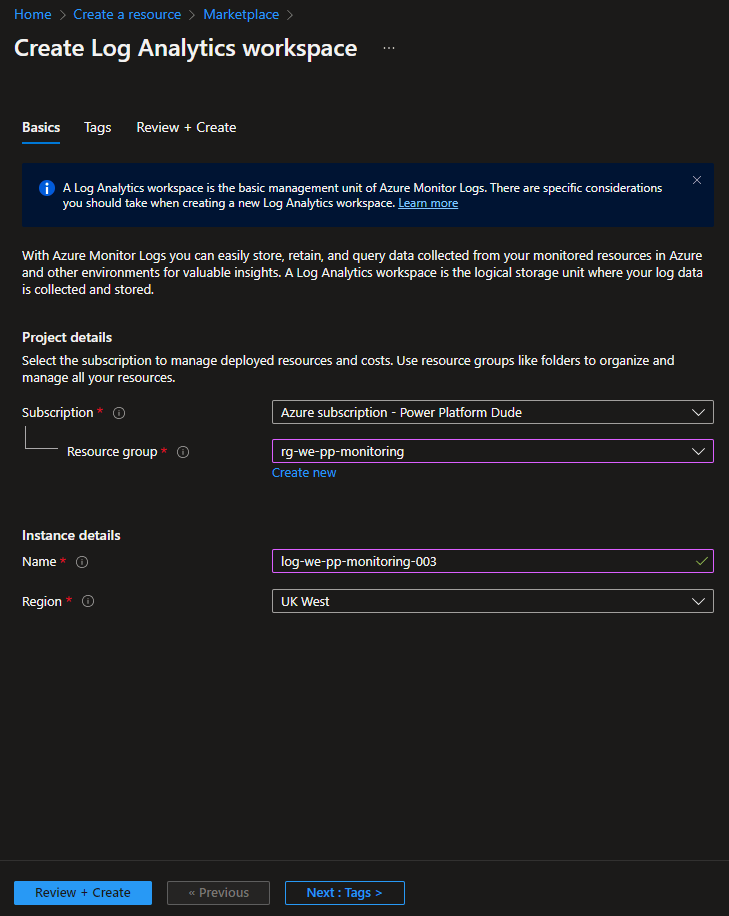
Step 01 – Create an Azure Log Analytics resource in Azure.
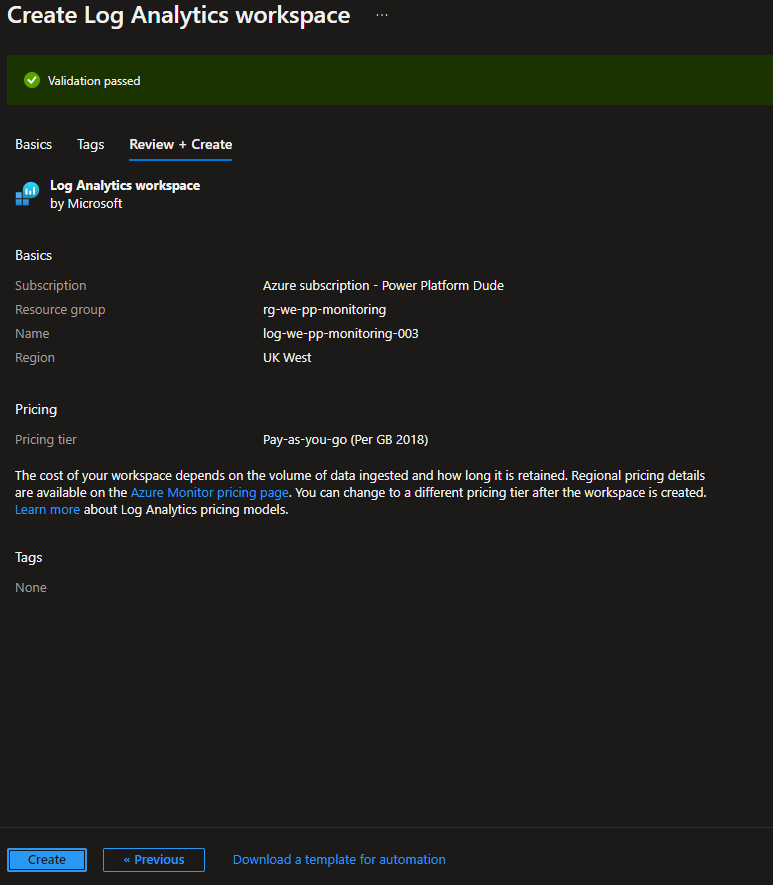
To create a Log Analytics workspace, log in to the Azure portal and click “Create a resource“. Search for “Log Analytics workspace” and click on create. Select subscription, and resource group, give the resource a name and select the Azure region. Click on “Review + Create“, and then click on “Create” to create the Log Analytics workspace.
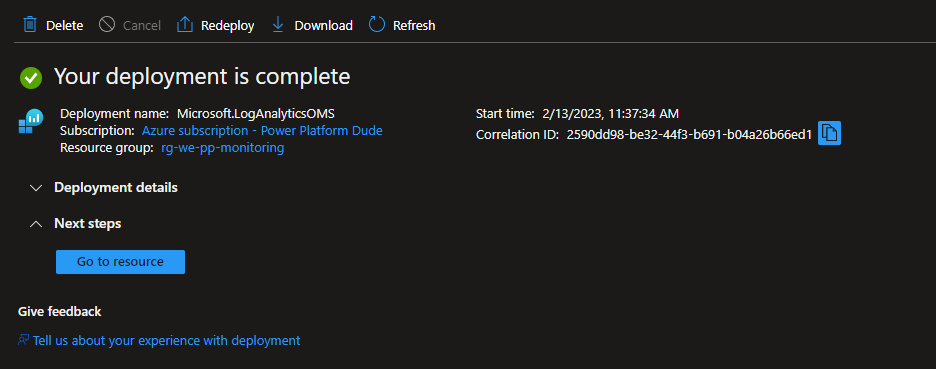
If deployment is completed, click “Go to resource.”
Step 02 – Create an Azure Application Insights resource in Azure.
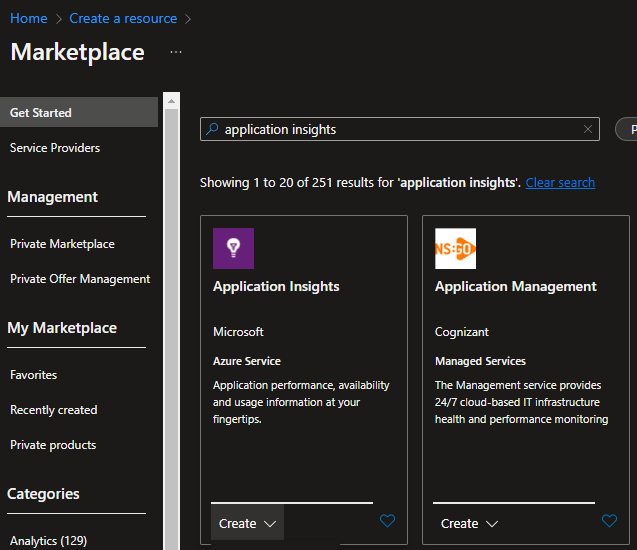
Go to the Azure portal and click on “Create a resource“. Search for “Application Insights” and click on “Create“.
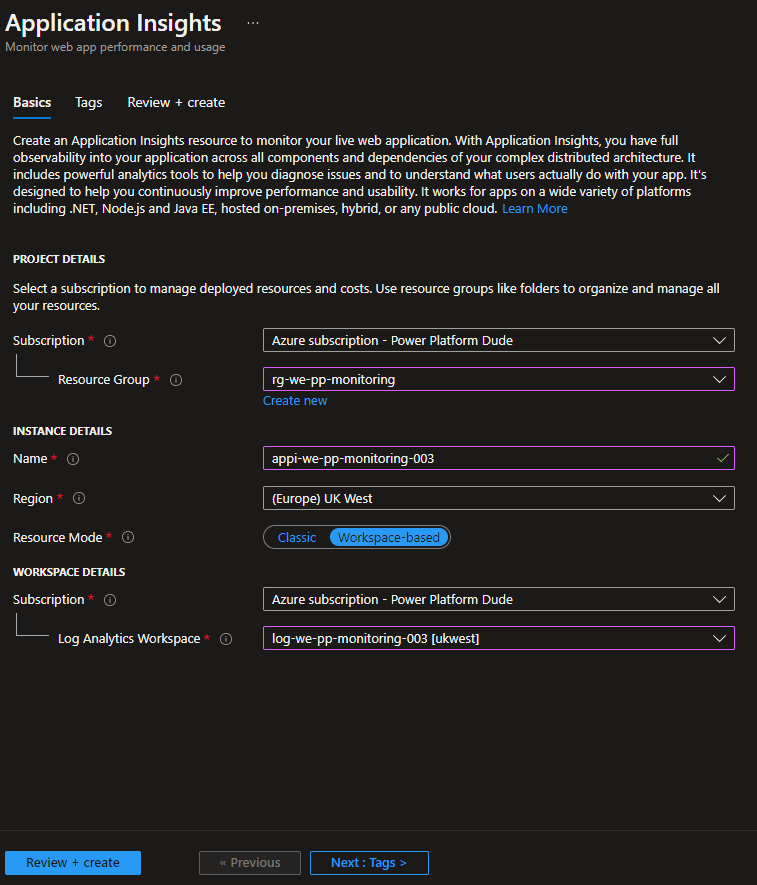
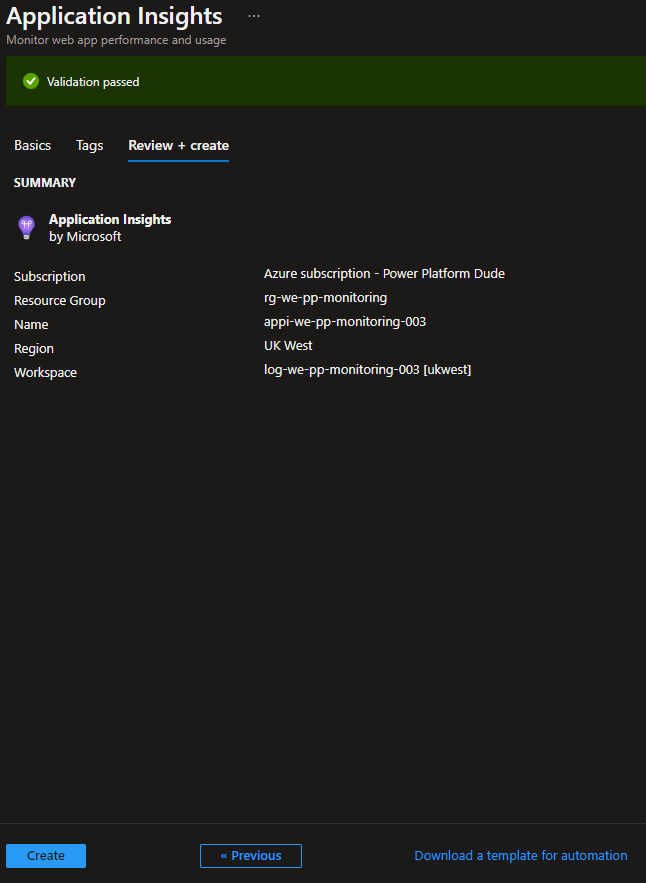
Select subscription, and resource group, give the resource a name and select the Azure region. Select the Azure Log Analytics Workspace that has been created in step 0. Click on “Review + Create“, and then click on “Create” to create the Log Analytics workspace.
Step 03 – Connect the Canvas app to the Azure Application Insights resource.
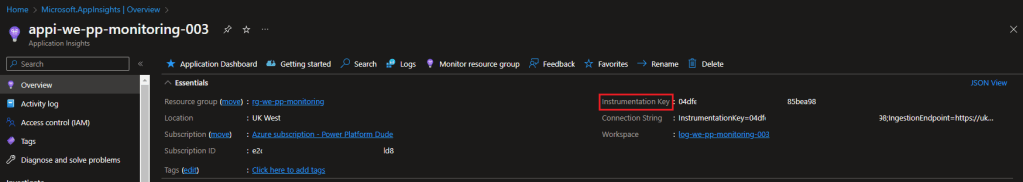
The Azure Application insights resource has been created, and it’s time to connect the Power Platform Canvas app to the resource. We need the instrumentation key of the create Azure Application Insights resource from step 02. The Instrumentation Key is a unique identifier for your Application Insights resource. The key can be found in the overview pane of the application insights resource. See the example below.
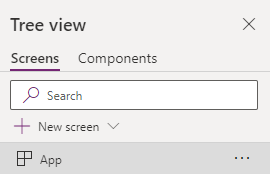
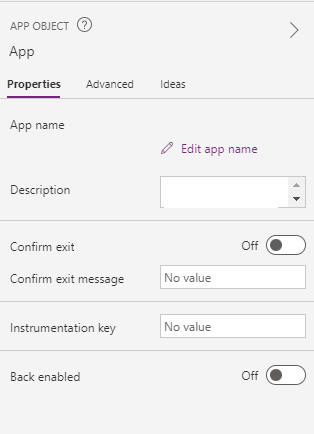
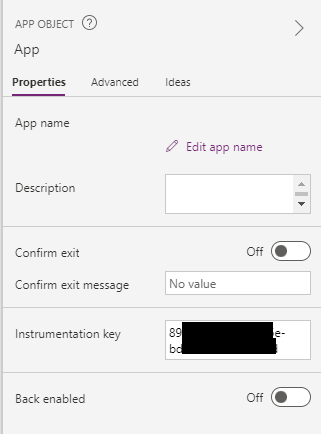
Open the Power Platform Canvas application in Edit modus that will be monitored by the Azure Application insights resource. Copy the instrumentation key and go to the “App” item in the tree view of the Canvas application. In the App Object, the instrumentation key can be pasted in the field “Instrumentation key”
Save and publish the Canvas App. It will take a short time that the first information will be available in the Azure Application Insights resource. These are the basic steps to install and integrate Azure Application Insights with a Power Platform Canvas application.
What do we see in the Azure Application Insights of a Power Platform Canvas app?
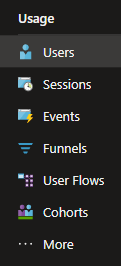
Standard usage data can be found in the left pane of the Azure portal. The following usage views are available:
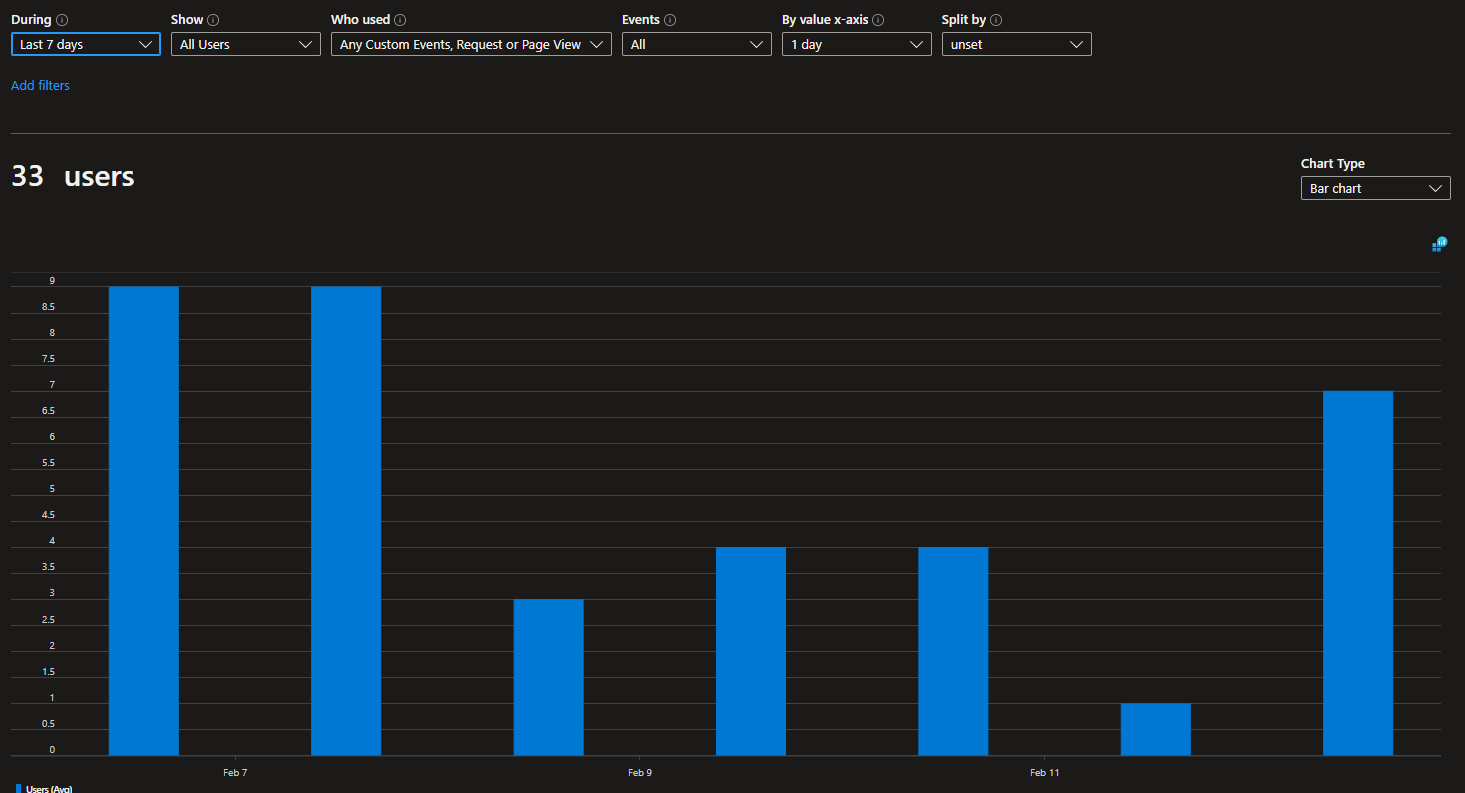
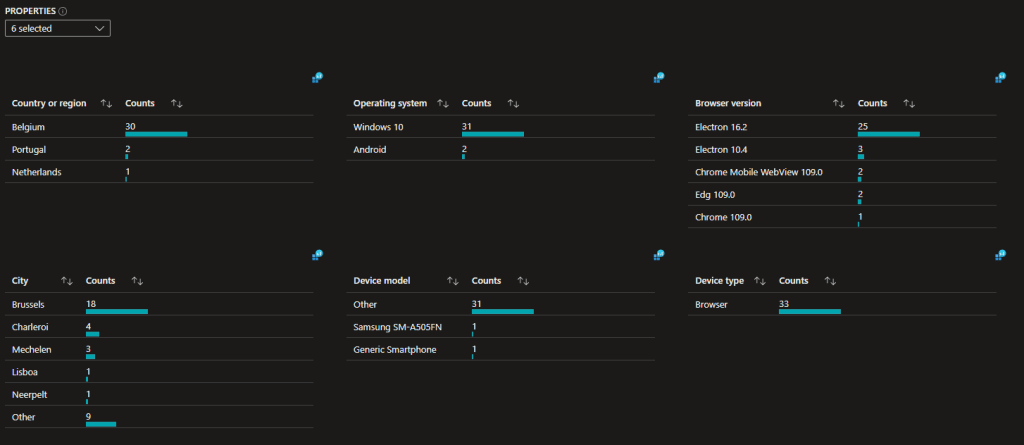
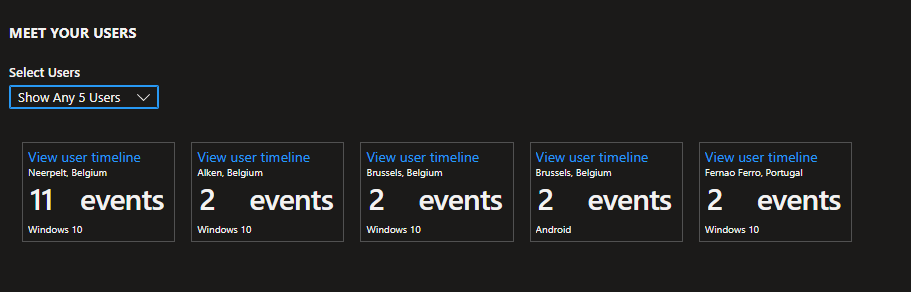
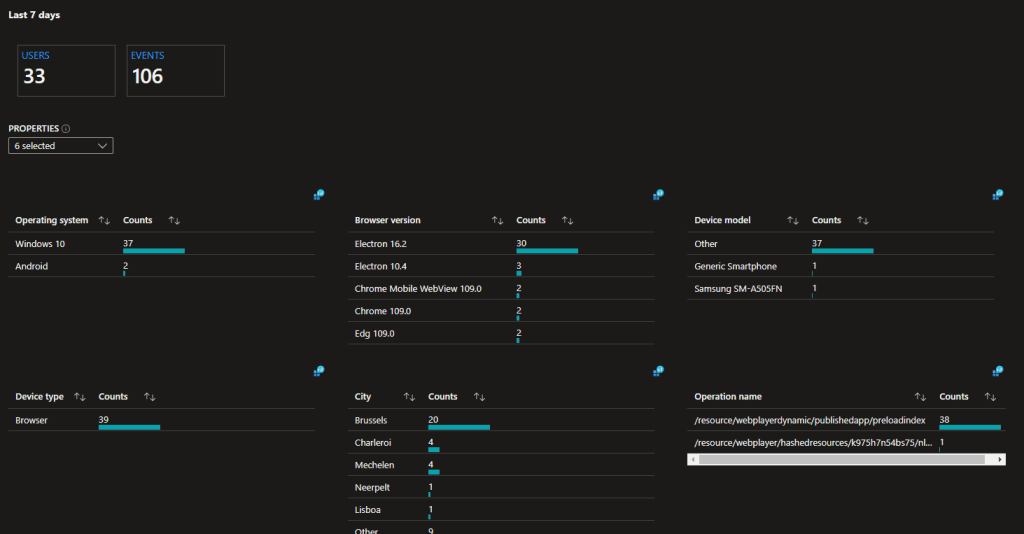
- Users: user access information and more insights. Access data will show the number of end-users connected to the canvas app in a specific time frame. The following insights are available sessions, events, performance, and a maximum of six different properties per-user access session, such as country, operating system, browser version, etc.
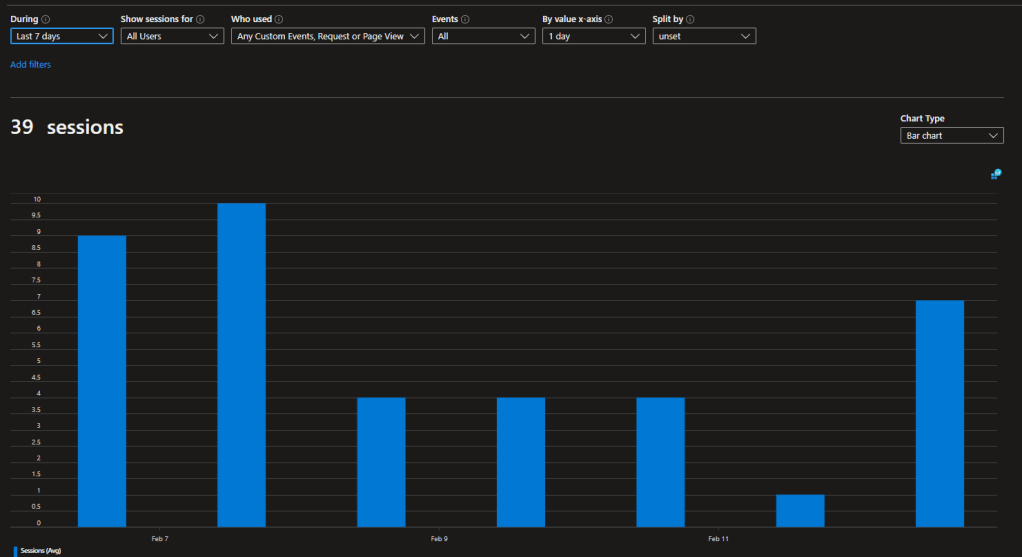
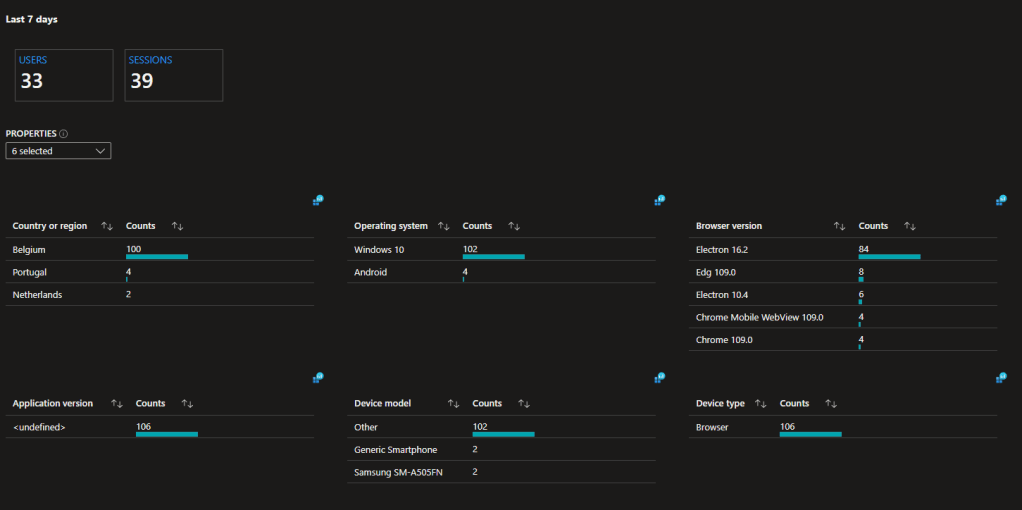
- Sessions: Session information and more insights. Session data will show the numbers of sessions that have started on the canvas app in a specific time frame. The following insights are available: the total number of users and events in the selected time frame, a maximum of six different properties per session, such as country, operating system, browser version, etc.
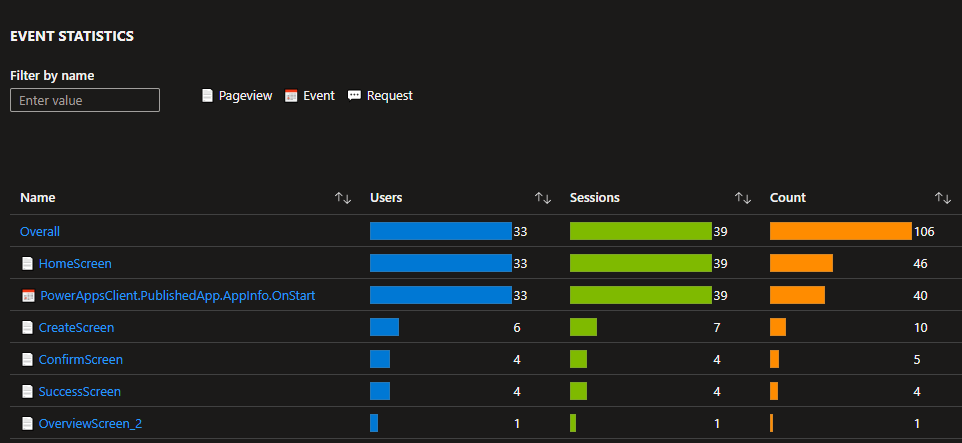
- Events: Event information and more insights.
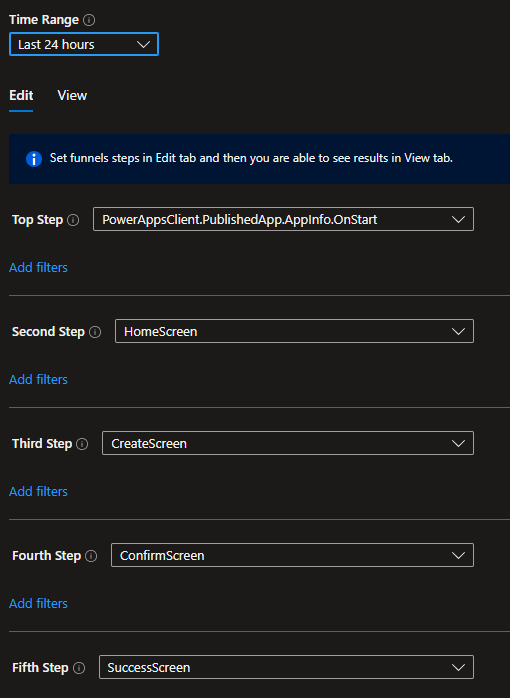
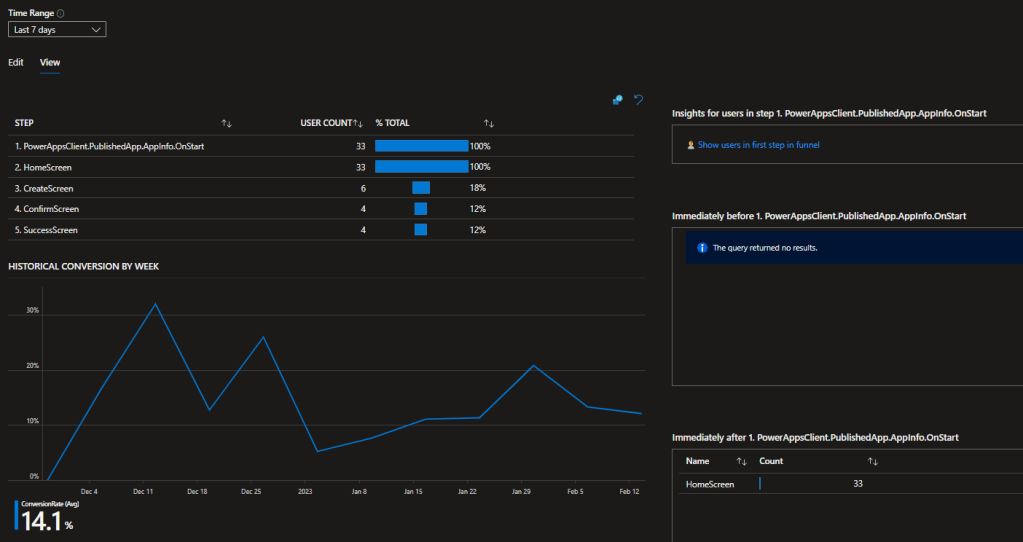
- Funnels: Funnels are used to understand the customer experience. If an application has multiple stages, Checkin the process is followed by the end-users through the entire process or ending the process at some points. The progression through a series of steps in a web application is known as a funnel. You can use Application Insights funnels to gain insights into your users and monitor step-by-step conversion rates.
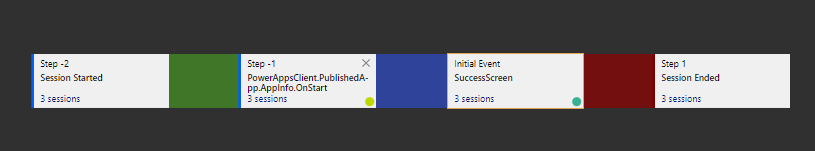
- User Flows: The user flows tool visualizes how users move between the application screens. Having an answer on How do users move away from an application screen? What do users select on the application screen?
- Cohorst: A cohort is a set of users, sessions, events, or operations with something in common. In Application Insights, cohorts are defined by an analytics query. In cases where you have to repeatedly analyze a specific set of users or events, cohorts can give you more flexibility to express precisely the set you’re interested in.
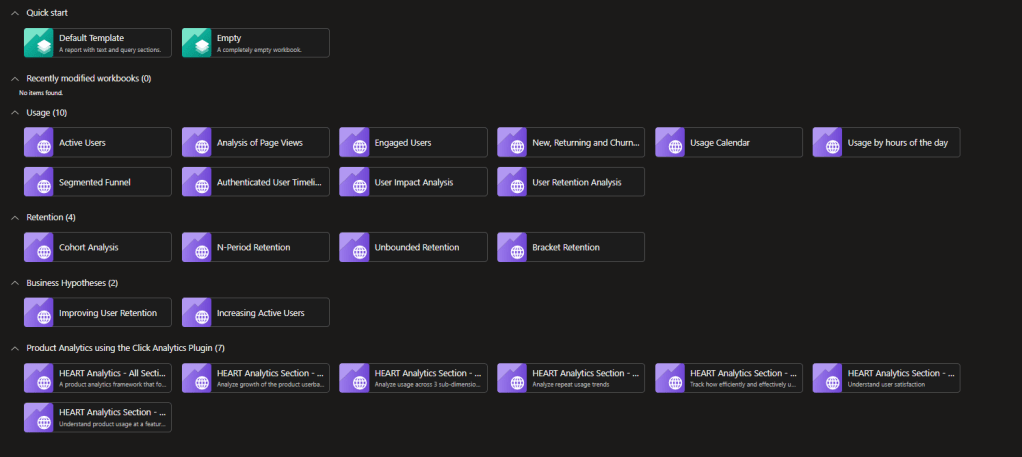
- More ...: Give an overview of public templates and workbooks.
Example users diagrams
Example sessions diagrams
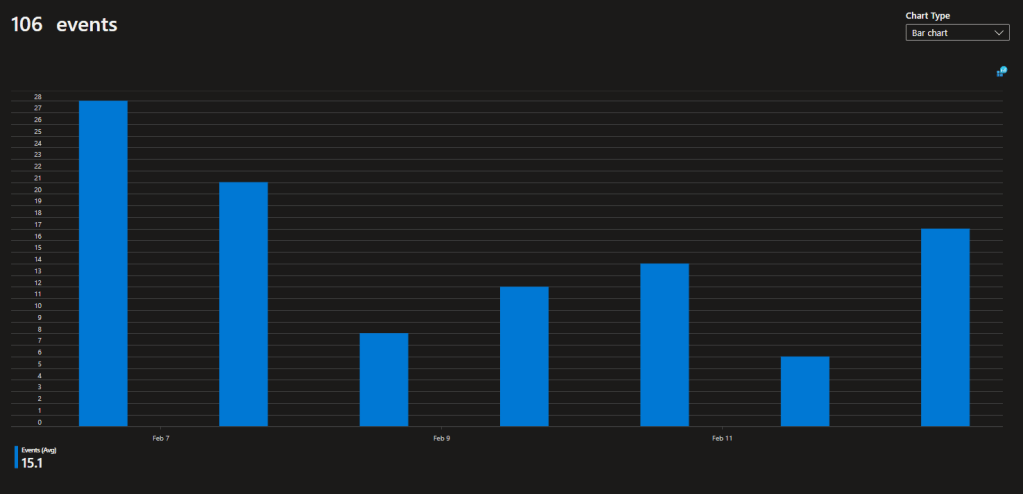
Example events diagrams
Example Funnels diagrams
Example User Flows diagrams
Public Templates
What is the cost of the Azure resources used?
It all depends on serval factors, including the amount of telemetry data collected, the number of features used and the scale of your application. Having two resources modes Classic [Will be retired in February 2024] and workspace-based [preferred method]. You can monitor your small application for some euro cents, a penny, or a dollar. Use the Azure Calculator to get more insights on the cost.
Conclusion.
Why wait for a quick insight into your canvas app application? I’m not waiting anymore, because it is:
- Quick and easy to set up.
- Easy integration with Azure Application Insights
- A very low cost for small applications.
Are you in to start to monitor your canvas app?
This is a first post of a series about monitoring Power Platform applications. If you like this blog. Please give me a dumbs up, share the blog or leave comments below.
